Ari's Unofficial Guide to the Birkie
2011 overall statistics.
For breakdowns by technique and race distance, skiers' hometowns and gender breakdowns see:
Charts: Age, Gender, Geography, By wave: Birkie Freestyle, Birkie Classic, Korteloppet Freestyle, Korteloppet Classic, overall stats
Data: State data for all finishers, State "competitions", "special data" search
Data which we now have: "time to the wire" data (how long it takes from the gun going off to the 300m timing wire—the top elites did it in 35 seconds) and a searchable database for viewing your place in your wave, your time to the timing wire and other such statistical wizardry. Want to see more data here? Ask nicely (email ari.ofsevit@gmail.com) and I'll see what I can do. Enjoy!
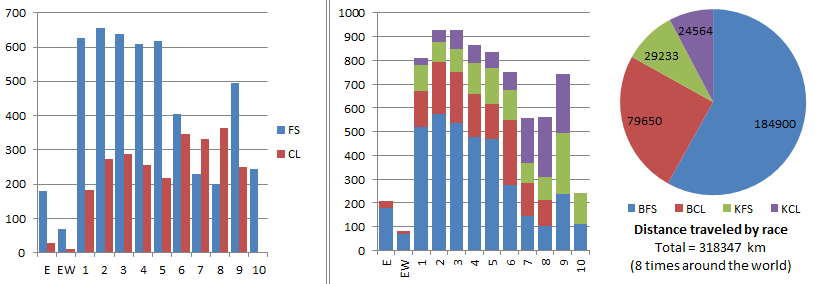
What races did skiers ski? How big were the waves? Overall, there were 3705 birkie skate finishers, 1525 classic finishers, and in the Korteloppet the numbers were 1271 and 1068.

After the size-limited elite waves, the first five skate waves were full, with more than 600 skiers in each. Most of these skiers were Birkie skiers; there were only about 100 Korteloppet skiers in each of the first half dozen waves. Everyone else was in it for the long haul. Wave sizes drop dramatically after the 5th wave, however, so that there are only 200 skaters going out in the 8th wave, although the 9th was appreciably larger. Overall, classic waves are more uniform in size; Birkie classic skiers crowd especially in to waves 2 to 6, with Korte classic skiers making up most of waves 7 and up.
The pie chart on the right shows the total distance skied by each cohort, 50k for Birkie skaters, 54k for Birkie stiders, and 23k for Korte skiers. The total distance covered was over 318,000 km, or just shy of 200,000 miles—nearly eight times around the world and 90% of the distance to the moon!
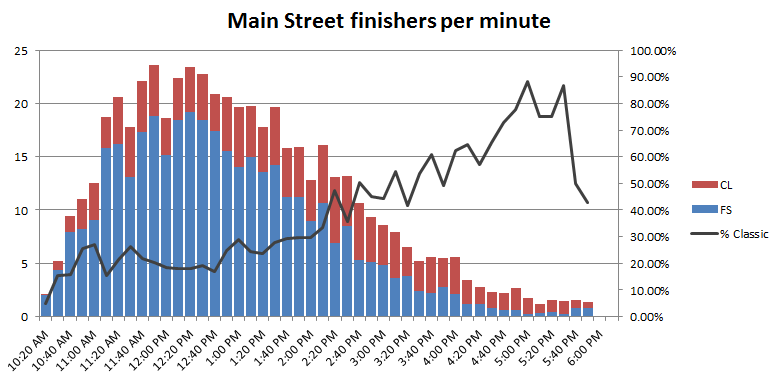
When did racers hit Main Street? Thanks to the time of day column in the results the Birkie gave me, we have a great picture of when skiers came down Main Street (with their eyes frozen shut; I enjoyed post race 2010 in 35-degree temperatures a bit more).

Racers started to trickle in to Hayward right at 10:20, and the deluge began shortly thereafter. By about 10:45, ten racers were finishing per minute, and from 11:00 to 1:30 the number hovered around 20 (that's one every three seconds for those of you keeping score at home). From the get-go, about one in four finishers is striding, although the proportion of striders jumps significantly around 2:00 and during most of the later afternoon they make up a majority of finishers, although there are many fewer finishers by 3:00 or so with only five per minute or so.
The classic waves can actually be seen in the early results looking at the percent-classic line—wave one comes in (peak 1) and then wave 2 (peak 2) followed by a long lull when there is both 20 minutes between classic wave starts (8:10 to 8:30) and a deluge of faster skaters skiing a shorter course.
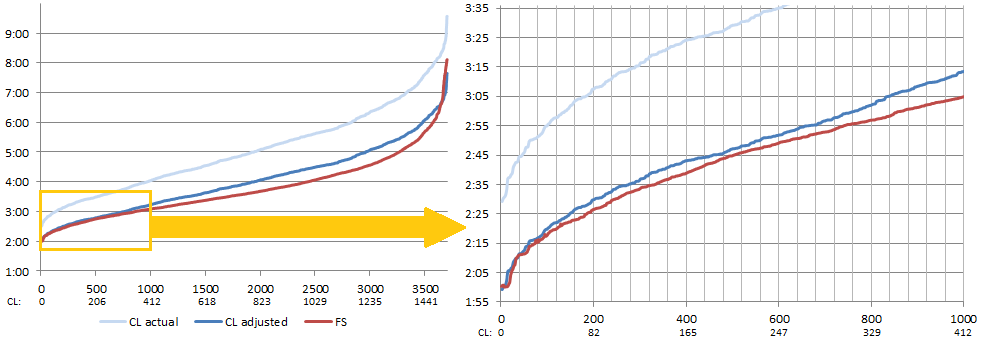
Speaking of classic, the Birkie calculates the "conversion factor" to convert classic times in to skate times, and vice versa. Basically, it takes the top five skate times divided by the top five classic times (I think), and this year the factor is 0.7992 (it has been as low as 0.73 in 2009). Basically, if you skied a 3:20 Birkie Classic, you're equivalent skate time would be 2:39 (200*.7991). Now, the ratio is just about right for the early finishers, but does it hold up for the rest of the race?

Yes and no. It does in the sense that the lines parellel each other pretty well, when we adjust the curves so that it assumes the same number of racers in each race (2.4 skate racers for every classic racer, so a skater in 1000th place would be assumed to come in around 400th place in the classic race). For the first 1000 skiers (see inset) the lines are only 1-3 minutes apart and waver within that range. But beyond that, the disparity widens. The somewhat skewed demograpics of the classic race mean that classic skiers, especially in later waves, are penalized to some degree.
In other words, the average classic skier is older (and thus a bit slower) than the average skate skier, but the Birkie basis times are not being taken from the full cohort. The times are being taken from the top five classic skiers and top five skaters. The classic skiers vying for money are good skiers, and although not necessarily the echelon of the skate skiers (nothing against Juergen Uhl or Jennie Bender), they are quite fast. So while they probably wouldn't have won the skate race, they likely would have finished with the lead pack, and been only 1 or 2% off the lead. The 0.7991 basis, based on the lead skiers, is signicantly higher than the average skate time divided by the average classic time (3:46/5:03=0.7455). So there is a slight penalty for older/slower classic skiers.
Charts: Age, Gender, Geography, By wave: Birkie Freestyle, Birkie Classic, Korteloppet Freestyle, Korteloppet Classic, overall stats
Data: State data for all finishers, State "competitions", "special data" search
© 2010-2011, Ari Ofsevit / birkieguide.com
This site is in no way affiliated with the American Birkebeiner Ski Foundation, the Birkebeiner or the Birkie. But it is a huge Birkie fanboy.
Ski, cross country ski, nordic ski