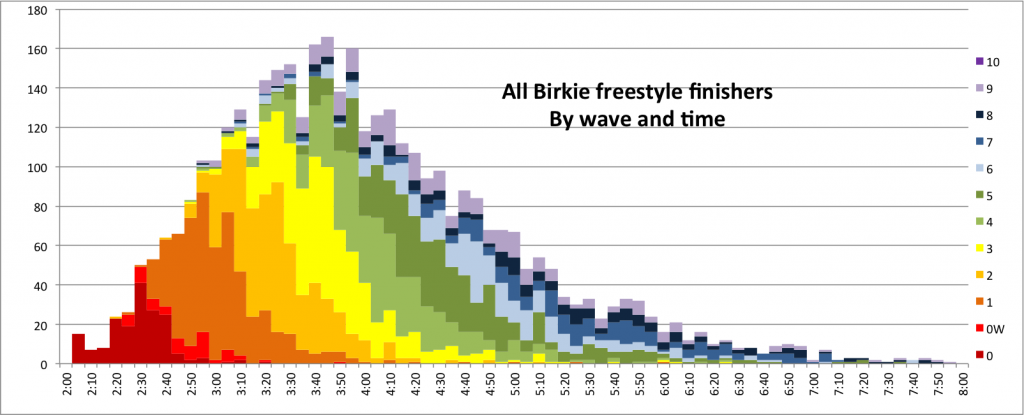
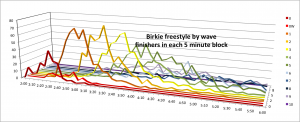
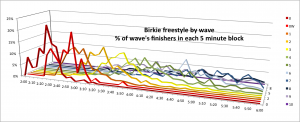
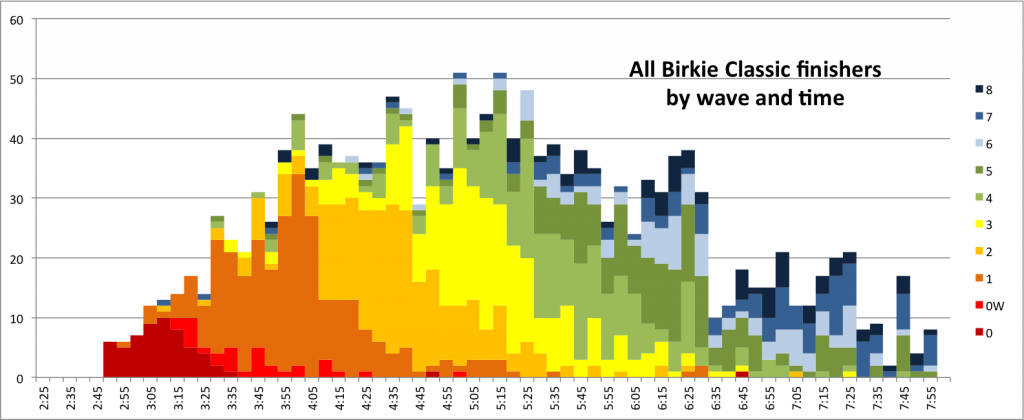
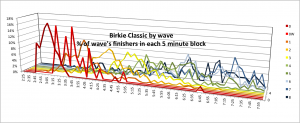
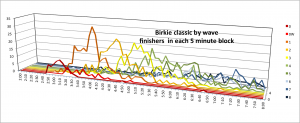
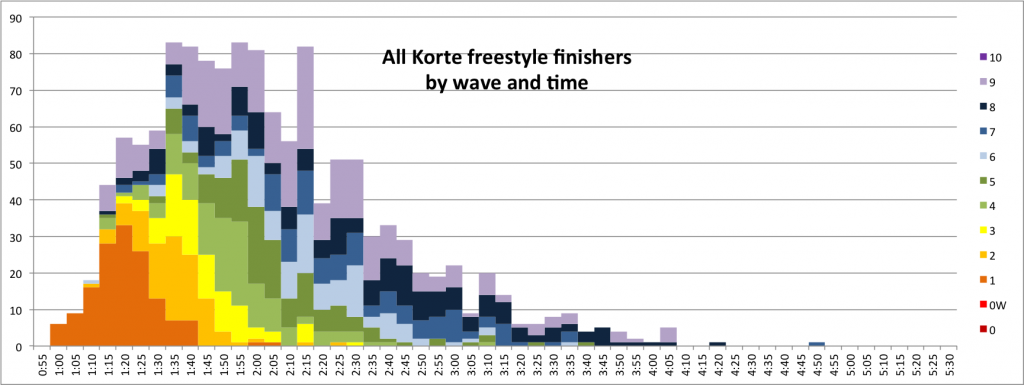
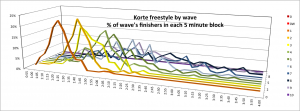
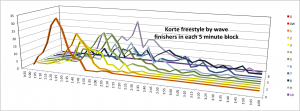
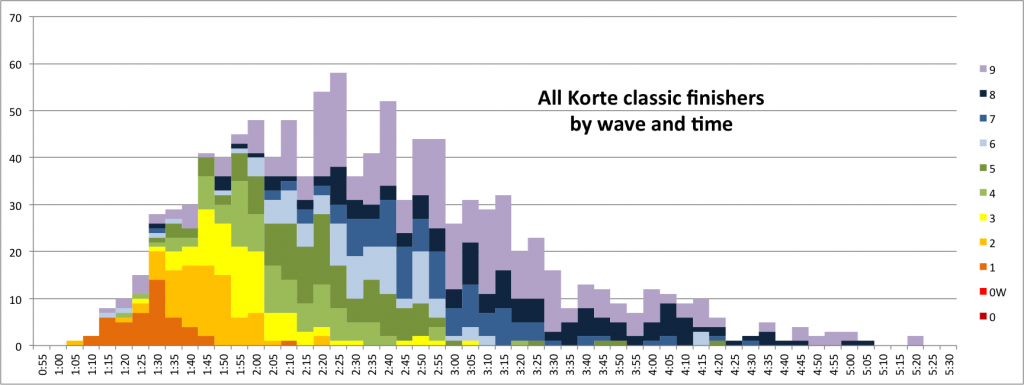
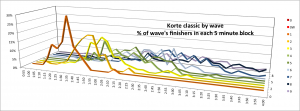
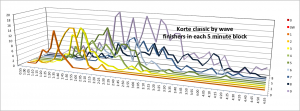
As with past years, we wrung through our data and come up with charts showing the finishing times for each division (Birkie, Korte, skate, classic) by wave. This year, it’s all on one page, broken out by race. The larger chart is the bar chart; the first 3D charts shows the same data (absolute numbers), the second shows these data as a percentage of each wave (in other words, it normalizes it based on wave size). As always, click to enlarge. And enjoy.
Birkebeiner • Freestyle
Birkebeiner • Classic
Korteloppet • Freestyle
Korteloppet • Classic

