Is the Birkie Trail hilly? In a word, yes. There are no pain-inducing 1000 feet vertical climbs that you might find at ski areas west and east. The midwest does not have that kind of elevation. What it does have, however, is continual ups and downs. The course (mercifully) gets easier as it goes along, but there’s a wall near the end, where the hills kick in again, before the blissful glide across Lake Hayward. In to the wind.
We detail the trail, kilometer-by-kilometer, elsewhere in this guide. What follows here are two charts of the trails elevation profile. To make these, the trail was painstakingly traced in gmap-pedometer to do so (it’s having trouble loading the whole thing) and then used Gmap to GPX to convert it in to GPS data. That was exportable in to excel, and from there it was a hop, skip and a jump (and some google searching to figure out how to convert latitude and longitude in to distance) to having an excel file with 2300 points each with a distance and an elevation.
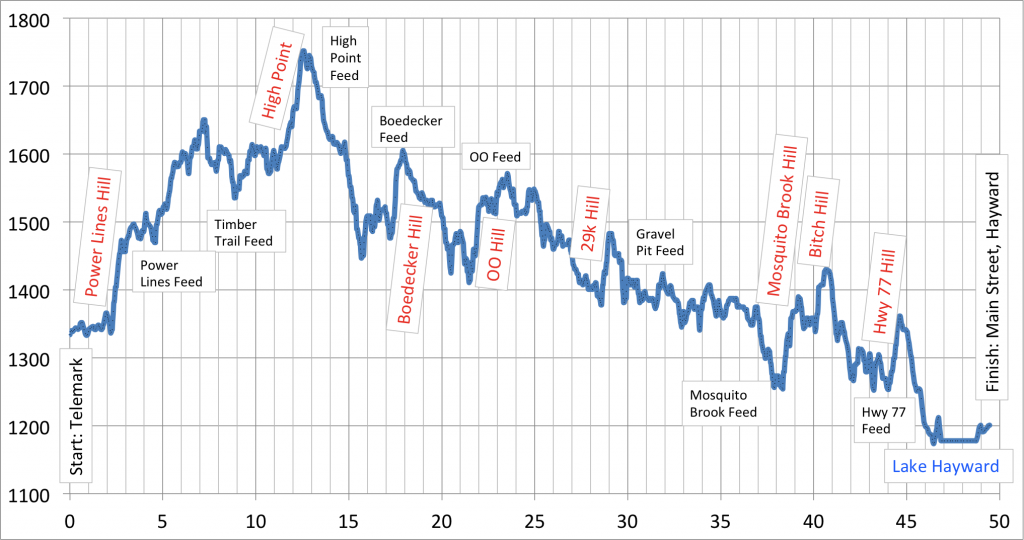
The first chart shows the elevation profile and major landmarks. Do note that this uses a weighted, moving average to smooth the line a bit. (NB: distance units are in kilometers, elevation units are in feet.)
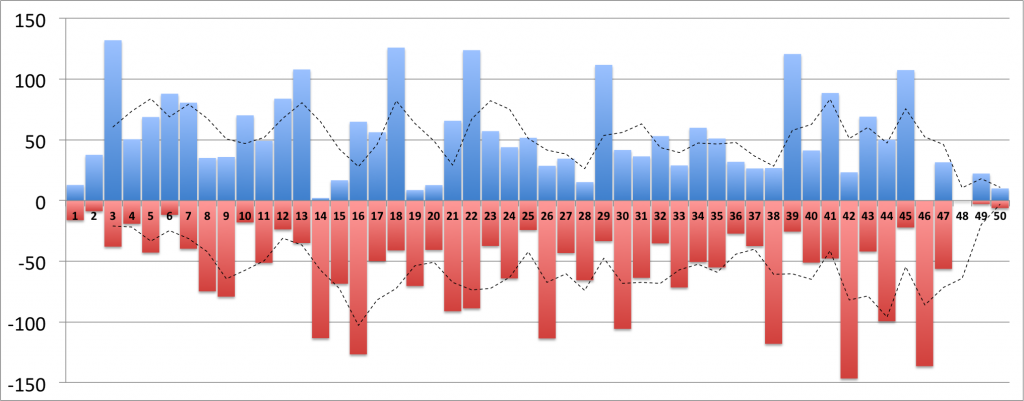
 The second shows, for each kilometer, the feet gained and lost in elevation. A moving average is calculated for each chart. Note how the trail can be broken in to several three-kilometer chunks of up and down, and how there is significantly more climb in the early portion of the race and again between Mosquito Brook and Highway 77.
