I got an email from a friend at the Loppet about a project he has to more scientifically test the speed differentials between different waxing techniques. Is this incredibly nerdy? Yes. Is this incredibly awesome. Very much yes. They come to the conclusion that a wax treatment can improve your time by 2:30 in the Birkie. That sounds about right. Of course, one wax treatment versus a similar one (i.e. Toko Blue vs Start Green) is probably even more minimal. It got me to thinking: how do temperature differences affect race speeds? Well, I have the temperature data. How hard can it be to compare it to finish times?
Not that hard. Here are the results. For each parameter, I compared the winning times (which is all that is available) for both the entire race period and for the period from 1987 to the present, which I define as the “skating era.” Times during the skating era are faster than before. A few major caveats:
- Up until 1991, the race did not always run Cable-to-Hayward. It ran Hayward-to-Cable from 1982 to 1985, and then alternated until Cable-Hayward became permanent in 1992. There is only about a 100 foot climb differential, however, and times do not seem dramatically affected by the differences.
- Apparently, the Birkie Trail has been shortened in the past 20 years. Until 1993, the race was listed as being 55 km. That year, it dropped to 52k. This dropped to 51k in 2001 and to 50k in 2008, although I can’t tell you where the trail lost 1000 meters between the 2006 and 2008 races (I raced both). By most measurements, the current race distance is almost exactly 50k.
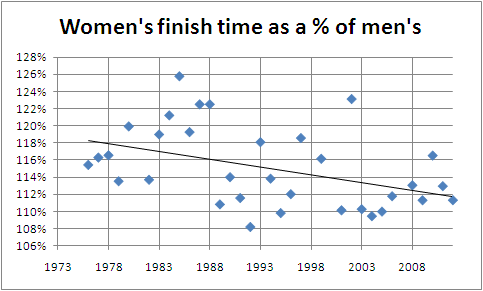
- I removed the first three years of women’s data; Jackie Lindskoog was the only female finisher in 1973 and 1974; and even in 1975 the women’s time-per-K was nearly double the men’s. Since then, the winning woman has finished between 8 and 26% slower than the winning man. (See below for more.)
- Data from races where the course was significantly shortened (i.e. more than the lake was left off—1981, 1998, 2000, 2007) were excluded.
- As we mentioned earlier, weather data previous to 1997 is based on averaging the data from Eau Clare (EAU) and Duluth (DLH).
First, we can compare the skier speed and the 8 a.m. start temperature. Here there is a very weak positive correlation (R-squared of 0.025 for men, 0.05 for women) between temperature and speed. This is probably random, as so much else (wind, snow type, skier tactics, the level of skier in the race) predicts the winning time; in fact, the two fastest winning speeds recorded saw temperatures between 0 and 10 above; and in 2011 a very fast time was recorded with temperatures below 0.
 I also charted the daily high temperature but expected these data to be even uglier since the daily high generally occurs long after the leaders have finished the race. And there’s not much to see in these numbers.
Finally, I charted out the winning times by year. Here there is a more dramatic correlation, although most of that is from the classic-to-skating switch in the 1980s. From 1973 to 1987, average times per kilometer decreased by nearly 2 seconds per year. Since then, times have again decreased, but by less than 0.5 second per year. And since 1992, times have been basically flat.
 Finally, women have been getting faster, relative to men. These are interesting data because while men and women ski the same course, they ski different races. I’m not sure when the women’s elite wave started, but there is definitely variation. I assume this is based both on who shows up for the race but also how it is skied. For instance, if the men have a pack which sets a fast pace and skis together they might record a faster time relative to a women’s race where the pack is strung out and broken up on early hills.
 It would certainly be interesting—if very improbable—if conditions and tactics conspired to have the women finish ahead of the men (say, for example, soft snow which was fast for the women but slower for the men, combined with race tactics allowing the women to speed ahead). But I doubt that will ever happen in my lifetime (and the best fit line here, which has an R-squared of 0.18, predicts it will happen some time in the 2080s).

