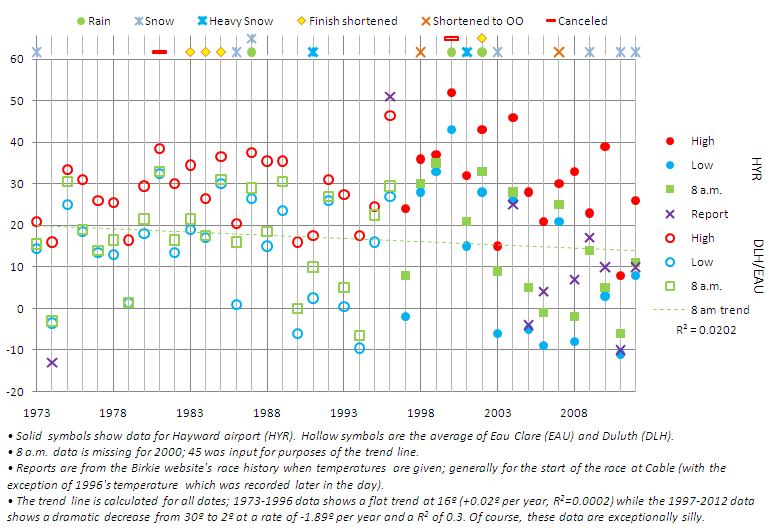
In the decade since I first wrote this there has been two Birkie days with warm weather (2016 and 2021, for people skiing Saturday in person), once with the race canceled (2017, 30˚ on race days but a week in the 50s before) and the rest have been pretty darned nice. Hopefully that continues. Maybe some day I’ll update these charts.
I’ve been asked more than once what the weather is like for the Birkie. It’s a silly question in some ways—temperatures have ranged from 10 below to 50 above on race day—but a good one in others. So to answer the question of what weather is on race day, here is some fun data. (What, you were expecting something else?)
Do note, we covered some broader-scale weather information on the 2012 statistics page. And we track weather up to race day on the homepage quite frequently.
Here are the data, in fun chart form:
N.B.: There is not data for the Hayward airport prior to 1997, so we averaged the temperature in Eau Clare (EAU) and Duluth (DLH) to get an approximation. Checking those against Hayward temperatures in recent years it seems to be a good approximation.
- The average high is 29º, the average low is 13º and the average 8 a.m. start temperature is 16º. Not too bad, eh?
- The coldest reported temperature at Hayward was in 2011 when it was -6º (and Cable was -10º). Four of the past seven years have seen the start temperature below 0º. The coldest DLH/EAU temperature was in 1994, when the average of the two sites was -6.5º. The coldest temperature reported by the Birkie for the start was -13º in 1974. And the course was uphill both ways that year, to boot. Pretty cold, eh?
- The Birkie has some luck, too. The 2009 race was held on February 21. Had it been a leap year, the race would have been on the 28th (last full weekend in February). That morning the low was -24º, and it was -17º at 8 a.m. (although it did reach in to the mid-teens later in the day).
- It seems like global warming is not affecting Birkie start temperature. In the past ten years, six races have started below 10 (three below 0). In the previous 30 years, only five races started below 10º, and only two of those broke in to negative territory.
- The highest start temperature was in 1999 when it was 35º as racers toed the line. In 2000, when the race was canceled, temperatures were quite a bit higher (those data are missing, but it was likely in the mid 40s). This is the only time the race has started above freezing; in 1981 it was warm but the race was postponed two weeks (except for elites and international races who lapped Mount Telemark six times).
- Since it’s late February, on sunny days the temperature often rises dramatically during the race. Four of the past eight years have seen the temperature rise by 20 degrees or more from 8 a.m. to the daily high. In 2008 and 2010 the temperature rose by 35 and 34 degrees, respectively. In 2008, the overnight low was -8º, it was -2º at race time, 22º at 11 a.m. and the high was 33º. In 2010, the overnight low was 3º, race temp 5º, by 11 a.m. it was 31º and the high was 39º. (Both these years were fine times to grab a beer and hang out on the lake.)This seems to be occurring more frequently in recent years, but that could be due to the data coming from Hayward and not EAH/DLH averaged.
- Snow is common during the race, falling about once every four races. Rain is less common, with only three races washed out in 40 years (including the 2000 cancellation). There have been two Birkie Blizzards in 1991 and 2001, each dropped 8″ of snow overnight and in to the morning of the start. 2014 saw heavy snow the day before the race which led to traffic nightmares, a very soft trail and slow times. 2018 saw snow the night before the Korte (slow and soft) and snow starting for later finishers of the Birkie.
- Only once, in 2011, has the mercury failed to make it past 10º. If the race were held a month earlier, this would be quite common.

