One nice, sort-of-new piece of data this year is of splits. (We calculated these last year, but presented them differently.) We basically calculated, between each time point, not only the splits for each skier, but how those splits compared to the overall pace for that skier. For instance, if a skier skied a 3:45 pace to Timber Trail, then a 4:30 pace to OO, then a 3:30 pace to Mosquito Brook and then a 4:15 pace to the finish (and with an average of 4:00), their paces percentages would be 94%, 112%, 88% and 106%. In these data, less than 100% is faster than the overall split, and more than 100% is slower.
Here is the chart for the all freestyle skiers. Last year, OO to Mosquito Brook was significantly faster than the overall race, and Mosquito Brook to the finish was slower. This year, the finishing segment is significantly slower (than the overall pace, and than last year) and there was the OO-MB wasn’t much faster than the other segments. Here’s the skinny:
 Something else to note is how there is more variability in the start and end segments. I’d chalk this up to one separate factor for each. For the first 9k, skiers are passing and being passed, bunching on hills and the like, which alters times. At the end of the race, there is a “long tail” to the slower side. Nnote how almost no one skis this segment faster than 95%, but there is a significant population which is in Bonk City and skis it at 115% or higher.
The classic race, however, looks significantly different.
 The start and end segments here are similar. However, classic skiers ski the OO to Mosquito Brook portion of the race significantly faster than their overall pace, and Timber Trail to Mosquito Brook significantly slower. We broke this out, and it was even the case for Elite classic skiers.
As with last year, we can ask “do the Elites ski a different race?” And as with last year the answer is, “yes, but only the really tippity-top guys.” Here is the chart for the Elite Men. (Elite women show similar trends, but the data are too small to chart well.) I annotated it, just a bit.
There is less variability for the first through third segments than the overall race, and the Elites ski the the OO-Mosquito Brook segment a bit slower (relatively) than everyone else (but they ski the first segments faster; this might be attributable to the slower snow conditions giving less of an advantage on this mostly-downhill section). But take a look at the last segment. There is a weird blip at 99%, something we don’t see in any other demographic. This is not a random group of fast Elites, but rather the lead pack, which sped up in the final kilometers. The rest of the Elite Wave slowed down and skied the finish at an average pace of 106%, about the same as skiers in other waves.
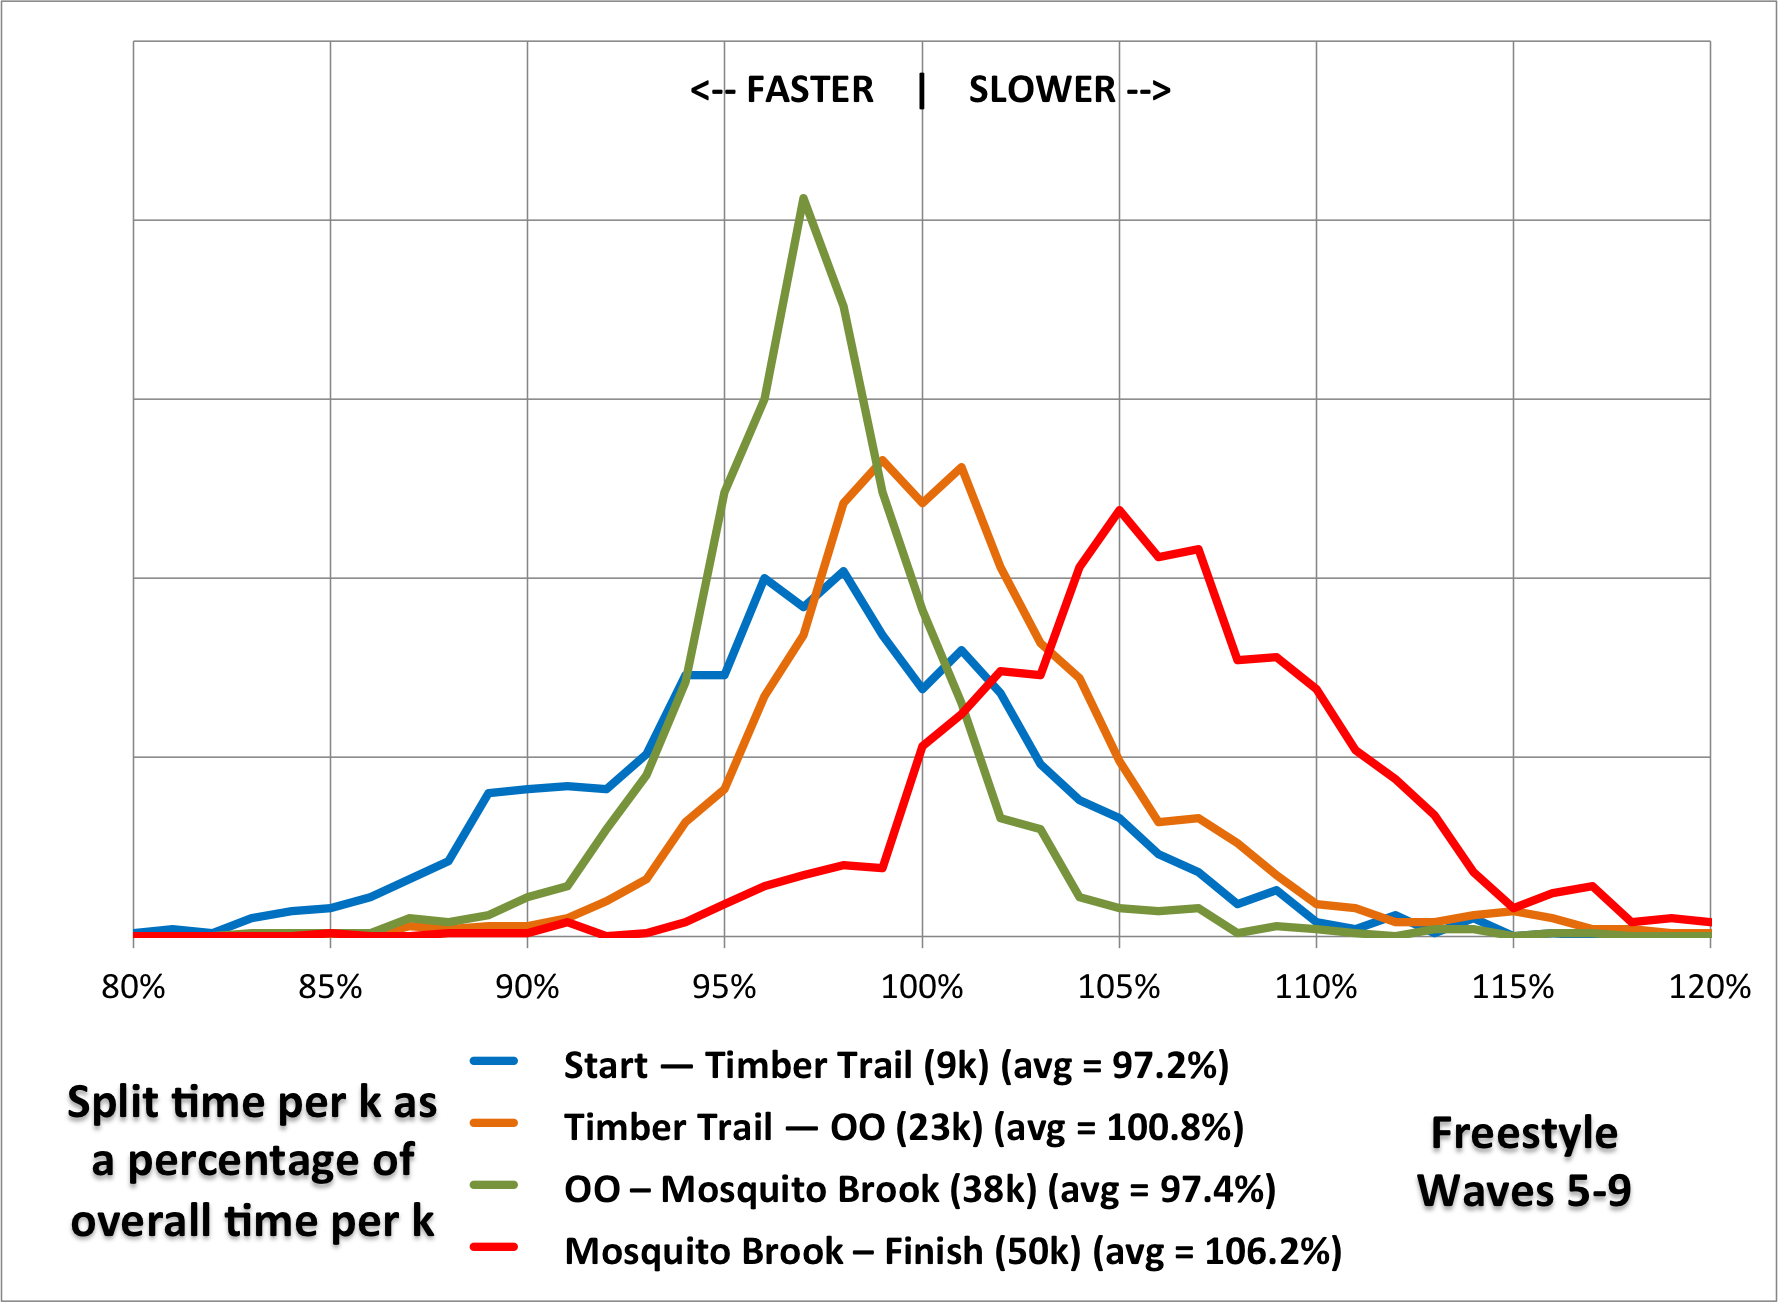
 The first wave skiers profile is closer to the overall race, although they ski the Timber Trail to OO section faster than the OO-Mosquito Brook section. Skiers in waves 2 to 4 (freestyle) have a profile similar to the overall race (since they account for most of the skiers in the race). Skiers in waves 5 to 8 have the opposite of Wave 1: their fastest section is OO to Mosquito Brook; and their times are less concentrated than earlier waves.

I expected that Wave 9 might have a different profile from early waves, but it does not. We looked at several other demographic groups (older vs younger, men vs women) and did not find anything particularly noteworthy.