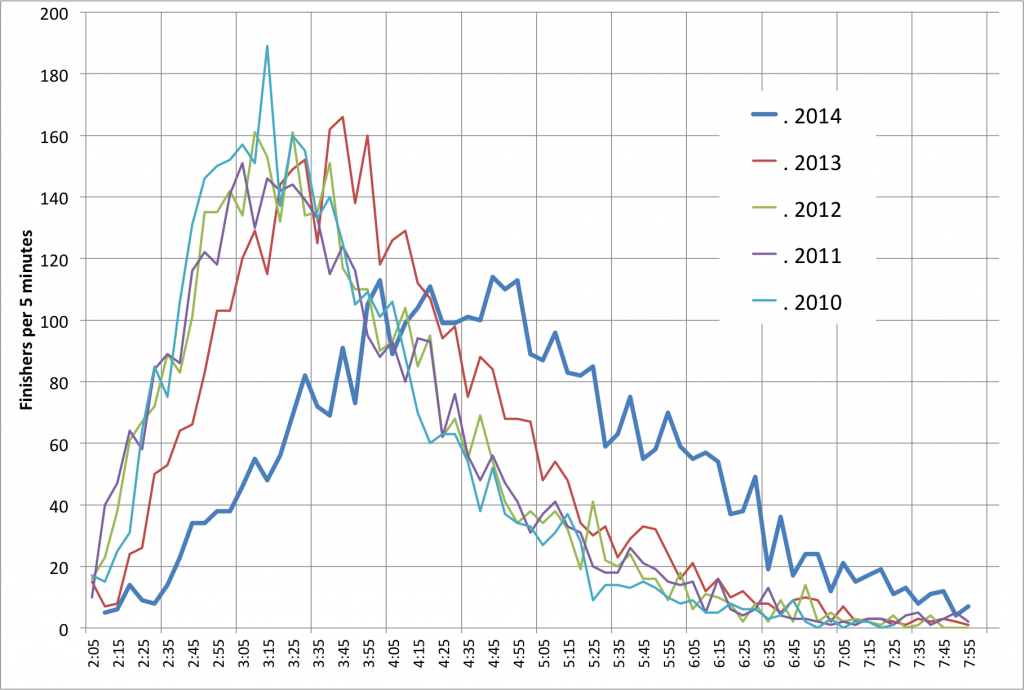
Everyone said that the Birkie was hard. It took a longer. A whole, lot longer. The chart below shows finishing times for the past five Birkies, for the skate race (other divisions coming; my computer went on the fritz and had to be repaired so I’m a bit behind). A couple of things to notice. First, the 2014 race was so, so much longer, on average, than the previous races. 2013—which was a slow year—shows longer times, but only slightly. 2014 is pretty much off the charts. Second, the finishing times are much more spread out. In the previous years, the peak 5 minute finishing time had at least 160 finishers. In 2014, it didn’t even make it to 120. So it’s a much flatter curve. Some more statistics below …

Want more? Here are some statistical statistics for the past five years.
| 2014 | 2013 | 2012 | 2011 | 2010 | |
| Total skiers | 3773 | 3951 | 3743 | 3699 | 3641 |
| Average time | 4:48:47 | 4:02:51 | 3:46:40 | 3:46:19 | 3:30:36 |
| Median | 4:44:23 | 3:54:03 | 3:36:20 | 3:35:05 | 3:21:04 |
| Stdev | 1:10:24 | 0:59:08 | 0:59:20 | 1:01:33 | 0:52:52 |
That’s impressive. The average skier finished this year in a hair under five hours. Last year, a slow year, the average skier just barely topped four. And compared with the fastest year in 2010 (quite possibly the fastest on record; the winning time was), the average times are nearly 40% longer. In other words, if an average skier skied at the same pace in 2010 for the amount of time they skied this year, they could turn around in Hayward and make it back to the Gravel Pit at 31k. So if it felt like skiing a 70k race, it’s because it pretty much was.
More analysis coming soon; for now I’m off to ski.
