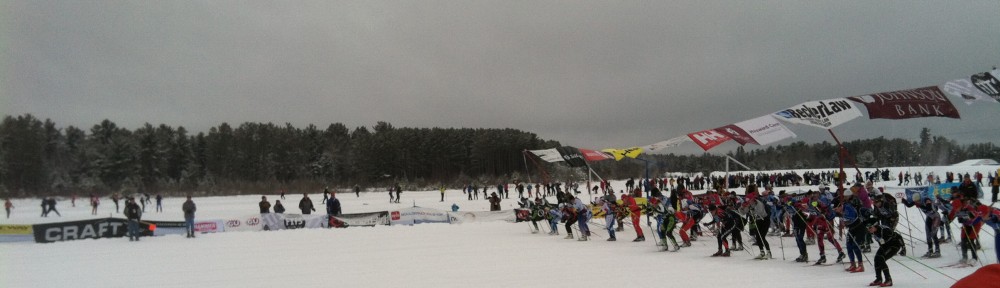
 So, I need some help. I have some really fun data. It shows, for every minute during the Birkie, how many skiers were at each quarter kilometer of the course. The example above, for instance, shows the state of the race—the actual position of skiers on the course, by wave—at 9:03 a.m.. The fourth wave is just setting out while the earliest waves are already forming packs. The front of the third wave is catching the front of the second; the front of the second wave is making progress in to the first. Pretty cool, right? (These are all based on four split times, so it’s not a perfect representation of exactly who is where, but it’s a pretty good approximation.)
I want to animate these, probably in to a Youtube or Vimeo and play it at, say, 5–10 fps (so each hour is 6–12 seconds and the whole of the race takes a minute or two). But there are (at least) two relatively major stumbling blocks, and if anyone can help, I’d certainly be grateful:
- I need to export 600 images. One for each minute, 8 a.m. to 6 p.m. I certainly could do this manually, but I would be driven to the drink well before the first wave arrived in Hayward. In other words, I need to automate this. I think it could be done in Excel; you’d need a Macro to find a piece of text, increment it, export the chart and loop back to the beginning. (Why the find-replace? The method I used to get the data was to calculate the position for each racer for each minute. I then ran a separate count for the number of skiers in each 250m block for a particular minute and made a chart. Then I run a Find-Replace to go from, for instance, cell AB to cell AC which increments one minute forward. If anyone has a better idea how to do this in Excel or in a SQL environment, I’m all ears.)
- Take all these images in to some kind of video-making program and compress it in to a “time lapse” thing. I think I know someone who can do this, but if anyone has those skills, and if we get to that point, I’d be very happy for the help.
If you can provide any assistance, it would be fantastic. Drop me an email (ari.ofsevit@gmail) or comment here (you need to log in; otherwise we get lots of spam) to get in touch. Extra bonus points if you’re patient enough to explain to me what you’re doing, instead of just doing it. I’d certainly give you lots of on-site recognition for any help, and probably buy you a beer in Hayward next February.
