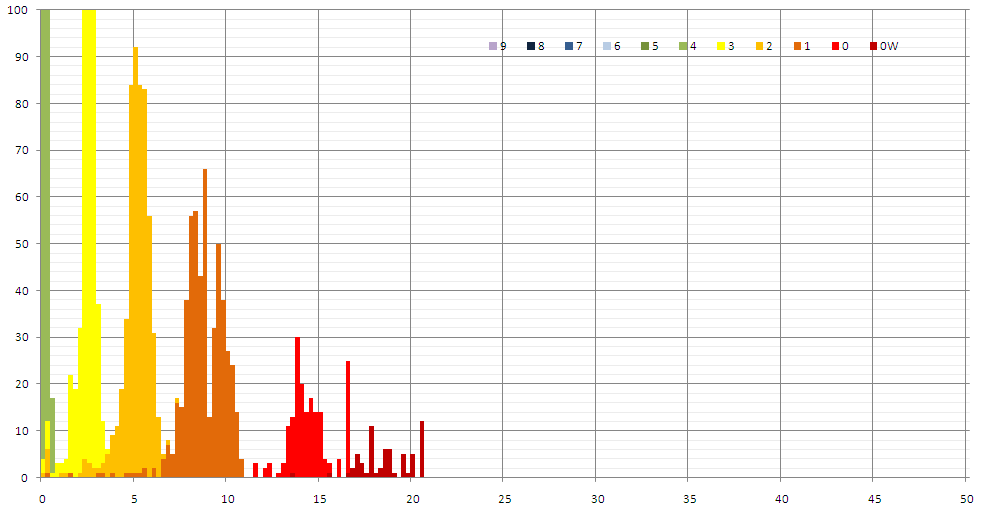
Anyone good at coding/data visualization?

So, I need some help. I have some really fun data. It shows, for every minute during the Birkie, how many skiers were at each quarter kilometer of the course. The example above, for instance, shows the state of the race—the actual position of skiers on the course, by wave—at 9:03 a.m.. The fourth wave is just setting out while the earliest waves are already forming packs. The front of the third wave is catching the front of the second; the front of the second wave is making progress in to the first. Pretty cool, right? (These are all based on four split times, so it’s not a perfect representation of exactly who is where, but it’s a pretty good approximation.)

I want to animate these, probably in to a Youtube or Vimeo and play it at, say, 5–10 fps (so each hour is 6–12 seconds and the whole of the race takes a minute or two). But there are (at least) two relatively major stumbling blocks, and if anyone can help, I’d certainly be grateful:

  1. I need to export 600 images. One for each minute, 8 a.m. to 6 p.m. I certainly could do this manually, but I would be driven to the drink well before the first wave arrived in Hayward. In other words, I need to automate this. I think it could be done in Excel; you’d need a Macro to find a piece of text, increment it, export the chart and loop back to the beginning. (Why the find-replace? The method I used to get the data was to calculate the position for each racer for each minute. I then ran a separate count for the number of skiers in each 250m block for a particular minute and made a chart. Then I run a Find-Replace to go from, for instance, cell AB to cell AC which increments one minute forward. If anyone has a better idea how to do this in Excel or in a SQL environment, I’m all ears.)
  2. Take all these images in to some kind of video-making program and compress it in to a “time lapse” thing. I think I know someone who can do this, but if anyone has those skills, and if we get to that point, I’d be very happy for the help.

If you can provide any assistance, it would be fantastic. Drop me an email (ari.ofsevit@gmail) or comment here (you need to log in; otherwise we get lots of spam) to get in touch. Extra bonus points if you’re patient enough to explain to me what you’re doing, instead of just doing it. I’d certainly give you lots of on-site recognition for any help, and probably buy you a beer in Hayward next February.


New things on the site

A few new things to note:

  1. New race reports. Check them out. And keep them coming!
  2. New Birkie Trail Subway-style Map. Yes, I am that much of a nerd.
  3. A post about the 100k day I skied on the Birkie trail a few years back. The weather should be just about right for something like that this year if the grooming holds.
Results: coming. Don’t hold your breath; once I have the data it takes a few days to get it in to a usable format.

There is still skiing. And no results.

In the northeast, there is skiing to be had. A surprise foot-and-a-half of snow last week prolonged the season; I’m slated to ski a 50k later this week. Last year, it was the last day of skiing, as the snow melted off the course during the race. It was followed by a week of temperatures in the 70s and 80s (!) which melted every last bit of snow in New England. In the midwest, reports are that there is skiable snow on the trails, with perhaps more to come. Duluth has two feet on the ground, and the UP may not melt until June. (And there’s no 2012-style week-in-the-70s coming there, either.)

This is all well and good, since I still don’t have results from the Birkie and there are still discrepancies. So, keep on skiing, and we’ll have data to pore over once the snow melts and you can sit outside with a mai tai and get a tan (July). And are we going to compare fat bike results with ski results? Will the new Pope be Catholic?

More race reports

Our race report section is rapidly growing. We have five race reports so far (and want to add more) from a variety of skiers, with some great stories. There’s Shawn, the first ever blind woman to ski the Birkie, and her guide, veteran Birkie Trail skier Jesse. Then there’s Nick, who dropped 60 pounds and quit smoking in pursuit of a Main Street finish. And Rob, a triathlete who skied most of his first Birkie with a full-on snapped ski. Oh, and if you really want, you can read my race report as well.

2013 Race Report is up

Want to read 4500 words about my race? It’s right here! Links and pictures will be added in coming days.

New this year: race reports from other people. If you want to send me a race report, I’ll post it. Just send it to ari.ofsevit at gmail and I’ll post it in the Race Report area of the site. A couple of guidelines:

  • Write something unique. If you write a couple paragraphs with the gist of “I went to Cable, the snow was soft, I skied to Hayward, I had a beer” it’s not telling us anything new.
  • Tell a story. 10,000 people skied the Birkie. There were 20 wave starts, two techniques, 88k of trails and about 15 bars at the finish. What happened to you?
  • Write at least a few paragraphs. It’s a 50k race and took you at least 2:09 to finish. Tell us about hills, feeds, race tactics, scenery, volunteers, mishaps, adversity overcome. Tell us something funny. Make it long enough that we want to read it.
  • Write it in paragraphs. Meaning—don’t just send a blurb of sentences run together.
I’m looking forward to reading about everyone’s experience!

Race report coming

Two hours on an airplane from MSP to BOS and I have about 4000 words of a verbose race report written. I have to finish it up when I’m home from work (yes, I went straight from the airplane to work) but it’s coming soon! If for some ungodly reason you’re interested.

And then there’s more to come after that. Elevation data. Data data. Data data data!

I am a huge nerd. But I am sitting, right now, in 169th. And despite a valiant effort by Ms. Alex Jospe, I won Massachusetts. (Because we know that Ali is from Poughkeepsie, NY, not MA!)

Quick post race note

Im sure you’re all waiting with baited breath for a full race recap. What? You’re not? You’re asleep? Okay then. Anyhow, keep waiting. I’m writing this on my phone and it’s too late to say much other than that the course was beautiful and slow and soft and I think I have my best result yet in 168th but there were technical glitches and I’ve gone from 177 to 206 to 188 to 168 so far. So we’ll see where it all shakes out. Good night!

The data are here

After a couple too many nights not getting to bed on time, I’ve finally gotten the ducks in order (I hope) and launched everything on to the statistics site. So if you are bemoaning the early spring and want to launch yourself deep in to mostly-meaningless statistical “analyses” from the race, by all means, go ahead and do so.

Let us know if there’s anything else you’d like to see. I can make no guarantees—it’s time to spend my evenings doing something more productive, like training and core—but if you have an interesting idea, have at it.

199th!

After a formal protest, the Latvian speedster has been properly seeded (and did not come in 14th) and another skier has dropped out of the ranks (someone without a start time, it seems) and your’s truly has moved in to 199th place. The cookie is crumbling in the right direction.

(Statistics charts are mostly done; they’re coming online soon.)