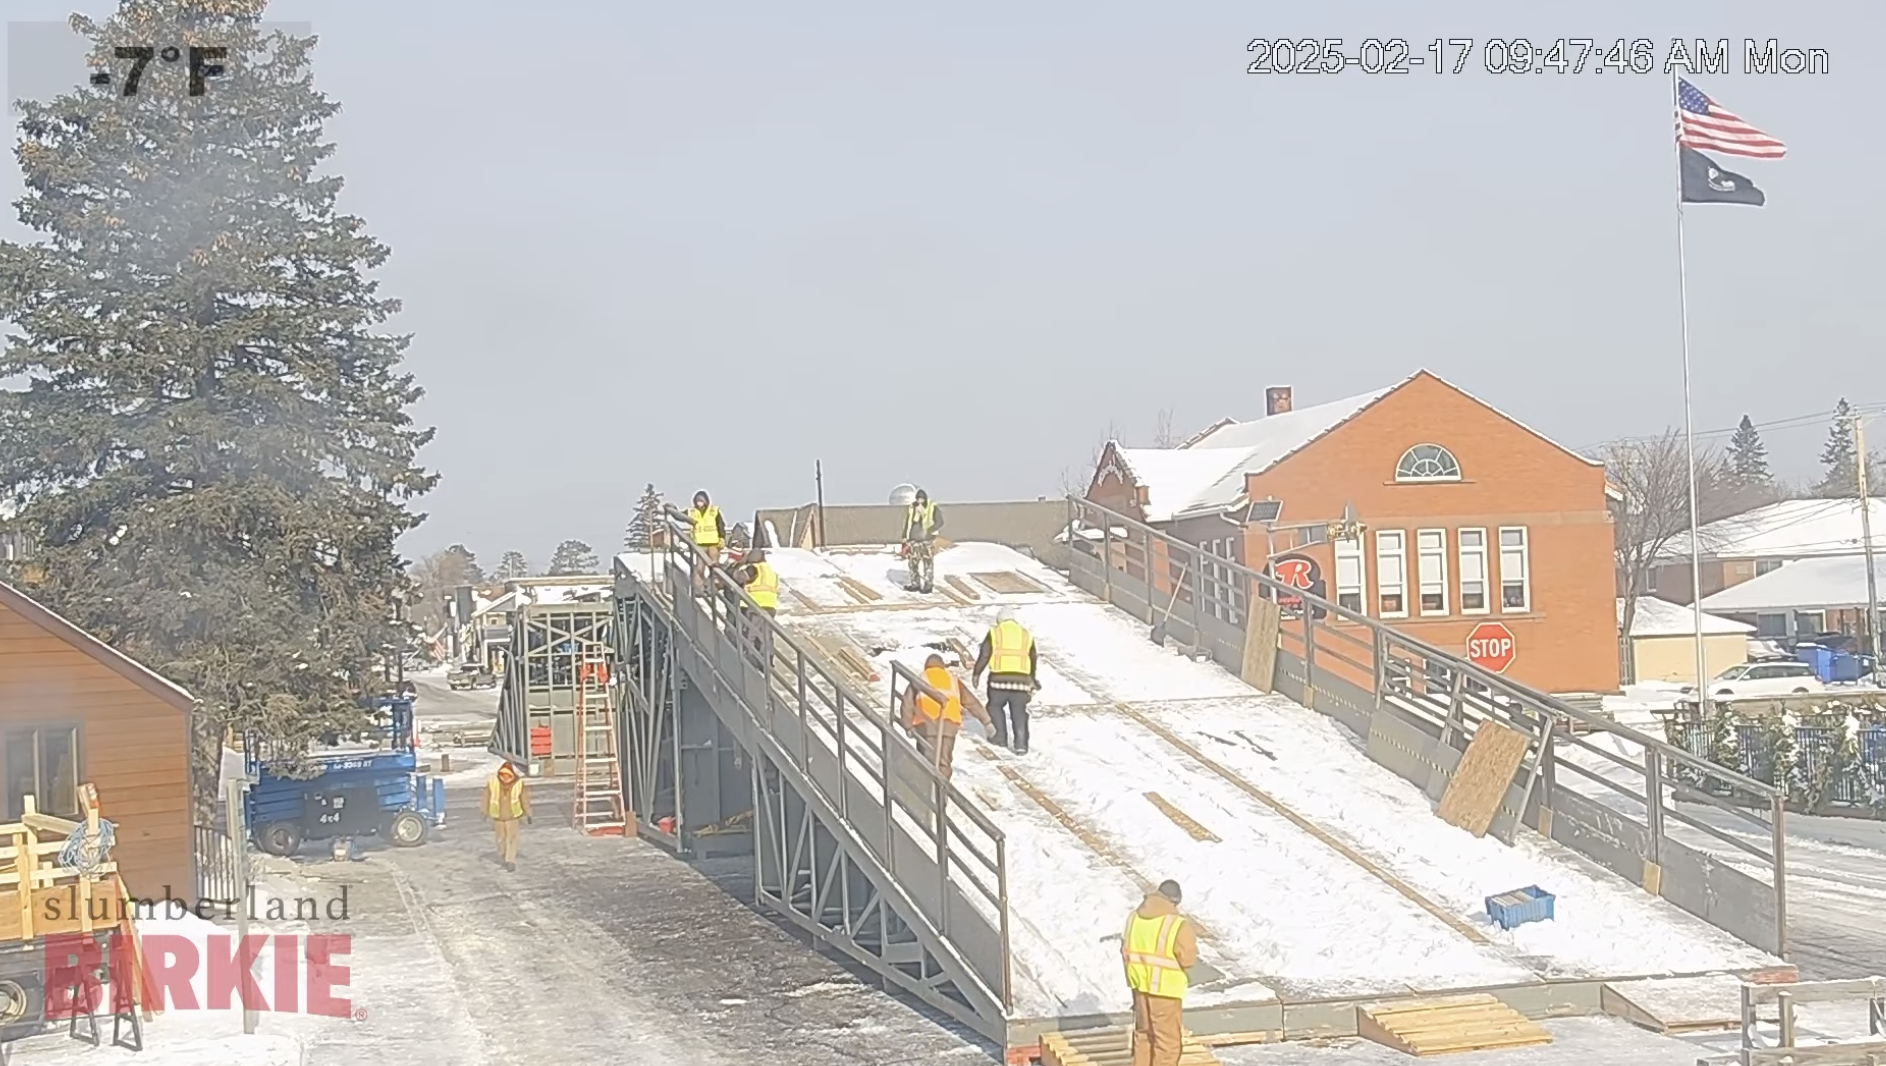
For the first time in two years, the bridge is going in over Main Street. And it’s only 7˚ there! (The wind chill is about -25˚.)
For the first time in two years, the bridge is going in over Main Street. And it’s only 7˚ there! (The wind chill is about -25˚.)
If you want to get your fix of the Birkie Trail before race day, right now is your last chance. The trail closes at midnight and is closed Monday and Tuesday before the Open Track event on Wednesday.
If you go elsewhere, I wouldn’t expect busy trails with this weather:
Mostly sunny and cold, with a high near 0. Wind chill values between -25 and -35.
We should all be thanking our deity of choice that the Birkie is Saturday (Partly sunny, with a high near 22) and not tomorrow.
If you’re skiing the Open Track, bundle up. Temperatures will barely crack zero (although winds should be calmer). Thursday and Friday will be up towards 20.
At the first Birkie webinar, they said they really needed about a foot of snow to have a good race. 10 days later, the results are in and Hayward has received 13″. It hasn’t been the thick base-building snow they would have liked, but it’s a foot of snow and it’s been cold, and with 5″ coming yesterday and a bit more during the day today, the Birkie should be in business for a perfect trail.
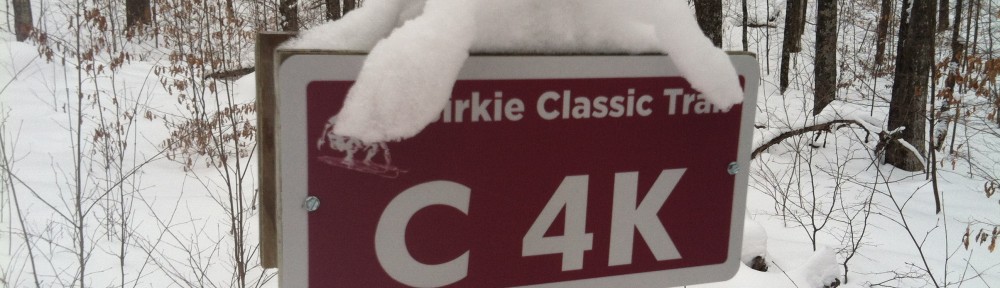
This is quite impressive given the situation two weeks ago, when the trail had lots of visible grass and dirt. Hayward had seen a total of 6.3″ of snow in all of January after a nearly snowless December (and one which had a warmup at the end which melted anything which would have been there. Here’s a photo from Skinnyski on Jan 26 from Jack Burns:

Here’s Mike Keyes on Jan 18:

It was a bit of a hopeful/gutsy call by the Birkie staff to put their faith in the weather forecast (and, to some extent, climatology) and go with the full course, but we will all be rewarded with a course which, I expect, will bear no resemblance to what it looked like a few weeks before.
I’m not concerned about a warm-up before race day. The snow that’s there, and whatever falls this weekend, will be there. 2017 this is not. Except for Friday and Saturday, when the temperatures will reach to nearly 20 (balmy!) Hayward shouldn’t break 10 until next Wednesday. Lows most nights will be in the -10 to -20 range, and often colder. We could race in that, but like Bartleby, I’d prefer not to.
Luckily, I don’t think we’ll have to. Take a look at the map below. It shows the temperature outlook for the week starting Thursday before Birkie. Since weather patterns often progress west to east in the US, this suggests that the pattern may start off colder and move towards warmer, and since average high temperatures in Hayward are nearly 30 in late February, we could be looking at near normal temperatures during this range. During a transition from colder temperatures to warmer temperatures, there’s often a departing high pressure system, which can mean cold but calm conditions to start with warm sunshine by afternoon, the perfect weather for the Birkie,.

Reading the model tea leaves, they all suggest this in the longer range, but occurring at different times. The GFS suggests that Friday (Korte Day) would be around -20˚ to start, but “warm up” to nearly 20˚ by afternoon. Birkie day would fall back to 10˚ to 15˚, but make 30˚ by the Lake (this is my favorite Birkie weather). The European and Canadian models shows this happening a day later (with Korte Day barely making it to 10˚, and Birkie Day maybe making it to 20˚). If they’re right you’ll need more Aquavit to stay warm cheering on the lake!
(* probably, but isn’t that always the case?)
As you may have heard on the Birkie’s webcast, or as you may have heard on our podcast, the Birkie has gone out and sampled, prodded and tasted the snow and they’re confident they can get the race to Hayward. That’s why everything south of Gravel Pit is closed to skiing: to give them the best opportunity to keep the course in the best shape they can get it in given the conditions. You may see some twigs or grass, but you’ll mostly see snow, for 50 kilometers (55 if you’re striding), from Cable to Hayward, as it is meant to be.
A bunch of notes!
And in case you were wondering, I’d guess there’s now a 90% change we go to Hayward. And the other 10% is nearly all a 45 kilometer loop, but even that’s unlikely. Guys, we did it. It’s not 2024 anymore.
Good Friday morning … here’s the latest on snow in Birkieland.
Wednesday evening’s snow fell quickly and steadily and blanketed basically the whole of the Birkie Trail with 2 to 3 inches of snow. The Birkie groomed the whole trail on Thursday although there are likely still thin spots and it is certainly not enough to allow the race to take place on the full trail, but it’s a start.
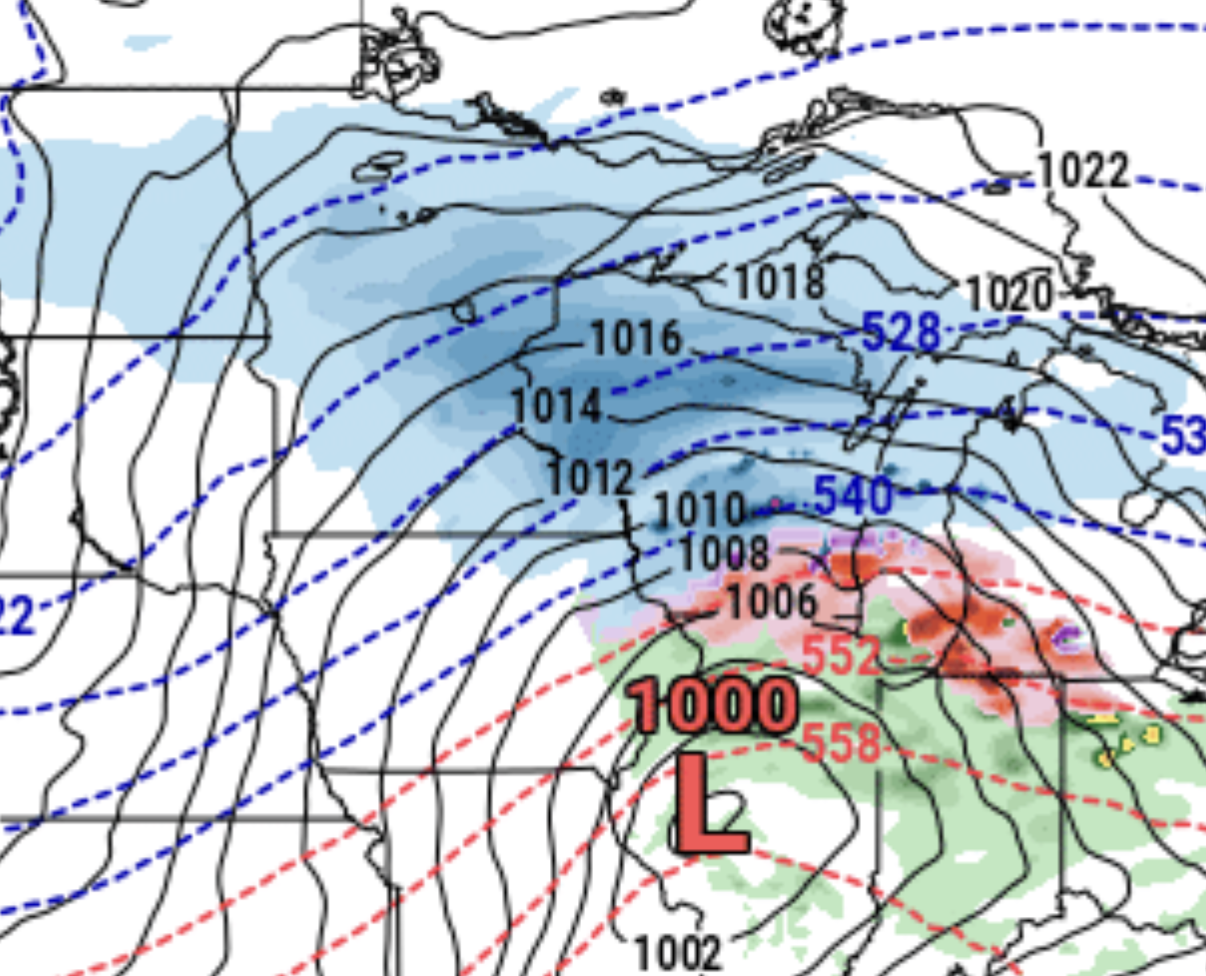
And that’s good, because something is coming this weekend. It will snow, the question is how much, and where the storm and gradient sets up. There will almost definitely be more snow as you go south, and the current forecast for Hayward sounds promising:
The latest snowfall forecast
favors the greatest potential for 3-6 inches of snow along and
south of US-2 in NW WI and south of MN 210 in Minnesota. The
highest of these amounts are generally favored along and south
of a line from Hinckley to Hayward to Park Falls where there is
a 20-40% chance of 6" or more snow accumulations.
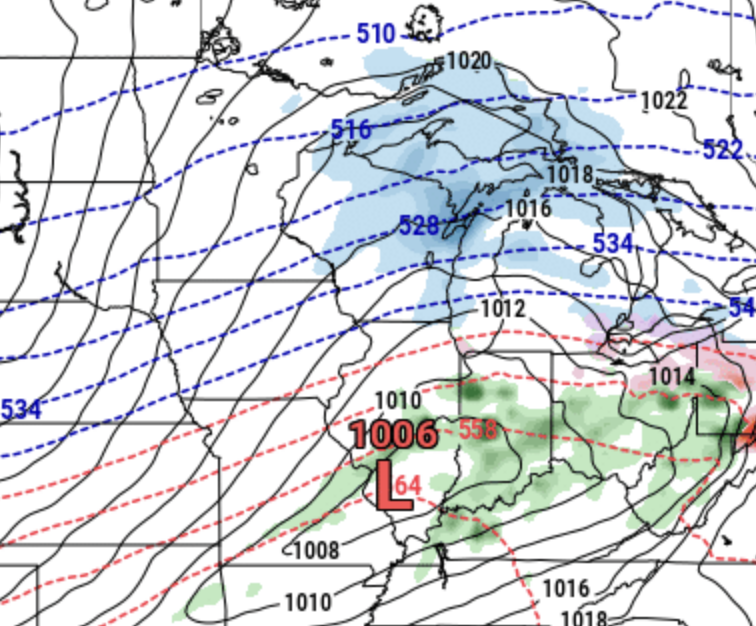
There are ifs there, though. If the storm tracks south by 50 miles (as some modeling suggests) then it could be around 0.2″ of snow water equivalent meaning 2 to 4″ (and this is relatively light snow) but then others suggest it could be further north, with more like 0.4″ with the same ratios and 4″ to 8″ isn’t entirely out of the question.
So we’re still on a knife edge here, but I am willing to slightly change my predictions to:
5% just manmade loops (~13k)
15% manmade + some natural loops (~20k)
35% long single loop to OO or Boedecker
43% full Birkie to Hayward
2% something else
We’ll know more on Saturday evening, and a lot more on Monday. As Ketzel said on the podcast, she doesn’t envy the Birkie staff having to make this decision, but hopefully it will snow enough that they will move forward with the full Birkie taking place and hoping for a couple more inches of snow before race day (which is likely in the longer term modeling), with the fallback of a long loop at Telemark.
Hope. It’s still alive.
Wisconsin notes from the Birkie staff update:
Schedule:
Feb 10: course announcement, live update
Feb 17: Live Q&A
Courses may be shorter, length will depend on the total length of the race, they can model out how people will move through the course. Classic may be a different day
Okay, so we need several inches of snow this week to at least give them the potential to start putting up the bridge. Any way that happens? It’s not impossible. Let’s look at today’s model data:
18Z GFS: 3″
12Z Euro: 6″
12Z Canadian: 7″
12Z GFS: 5″
06Z GFS: 6″
00Z Euro: 10″
00Z Canadian: 8″
00Z GFS: 7″
Okay, so the good is that the average of today’s model runs drops 6.5 inches on Hayward. The other bit of good news is that the bigger storm this weekend would have a northern cutoff, so it’s possible Cable could get 4″ and Hayward 7″ and that could be the kind of needle threading that would help the Birkie at least kick the can in hopes of getting a bit more snow next week (there’s an active storm pattern if it doesn’t get suppressed too far south).
The not so good news is that the models are trending less over the past 24 hours and this weekend’s storm track will matter a lot:
Not so bad: this morning’s Euro with a stronger storm further north.
Not so good, a weaker storm further south on this evening’s GFS.
This Thursday’s storm is probably good for 1-3″ of snow; there’s an outside chance of a bit more if it all lines up just right.
Which means, watch this weekend. If it can get in the 3-6″ range, then we may be in business. If it fizzles, well, better luck next year?
What does all this mean. Here are my best guesses for what we get:
20% race just on manmade at the trailhead (~13k loops)
20% race on manmade plus some natural snow (~20k loops)
25% loop to OO and back (45k single loop)
33% full course to Hayward
2% all hell breaks loose cancelation
Hopefully not too pessimistic! We’ll know more by later in the week.
* this is a reference to the 20-years-ago Man vs Beast race of Fox, where the zebra’s goal was to “realize it’s a race” and was then parodied on Family Guy.
That was in 1981. There was just enough snow left in Cable to have a race that year on Birkie day, although barely. What happened then? There was snow, but then it was warm. It rained. They considered moving the race to Ironwood. But Telemark had snow (it once was home to the largest snowmaking installation in the country, in 1961). Eventually something was cobbled together.
Friday (February 20) the elite race went out at 7 a.m., before the temperature got too high on a 6 kilometer course for eight laps (only 30 finished). International tour groups and Americans from afar went out at noon for 7 laps as temperatures reached into the 60s; 74 crossed this line. By Saturday, the snow was down to 1.83 kilometers, a few dozen skiers went around this course 23 or 12 times to finish their Birkie or Korte. (Results here.)
Then a colder snap brought snow, and a few weeks later, everyone else got to ski the race.
2024 worked out better, I think we can all agree. And if it snows next week (fat chance) you know the Birkie will get out and groom the trail.
Greetings Birkie skiers! It’s almost time for Birkie 2024. I went to the Korteloppet today so you didn’t have to and have some takeaways you may wish to consider to have the most enjoyable Birkie. In no particular order:
Is this optimal? No, optimal would be a beautiful course and a Main Street finish. But will there be skiing, beer and bratwurst? You better believe it.