The Birkie sent us some data they wanted charted out, namely the number of race participants over time. Their data went back to 2008, but I quickly ran through results back to 1999. (These are the only results posted on the website; I assume before that results were “mailed” out to people after the race. This sounds like alchemy during the dark ages or something.) In addition to looking at the growth of the race, I wanted to see how the makeup of the different races, by things like gender and technique, have changed over the years.
The Birkie has been on a growth spurt in recent years, growing from fewer than 9000 participants to more than 12,000. The increases have not been uniform, with more growth taking place in classic races than skate races.

If we look only at the four main races, we can go back further in time. To the future? Yes, all the way to the year 2000 (or, well, 1999). While the Birkie has grown dramatically in recent years, it was on a downward trend right after the millenium. From 6000 participants in 1999, the race decreased below 5000 in 2003, before beginning its current growth spurt. (We touched on the growth spurt last year, too.)

We can go further in to details. The left chart here breaks the race down by skate and classic skiers. Note that there is significantly more growth for striders than for skaters since the races were broken down by technique in 2002. The chart on the right breaks this down further, by distance, technique and gender. What’s really interesting here is how there has been relatively little growth for skating men—only 18% increases in the past 10 years for both the Korteloppet and Birkiebeiner. But for women, growth has been much higher, and for classic, higher still.
The growth in the classic race has been borderline exponential since 2008, when the classic course was first introduced. In 2002, only 75 women skied the full-length Birkie classic race. This year, nearly 400 participated in the race. In absolute numbers, there has been more growth in the skate race, but by percentages, the classic races have grown much more quickly (the men’s race has had more absolute growth than any other, growing by more than 1000—from 417 to 1419—in the past decade).

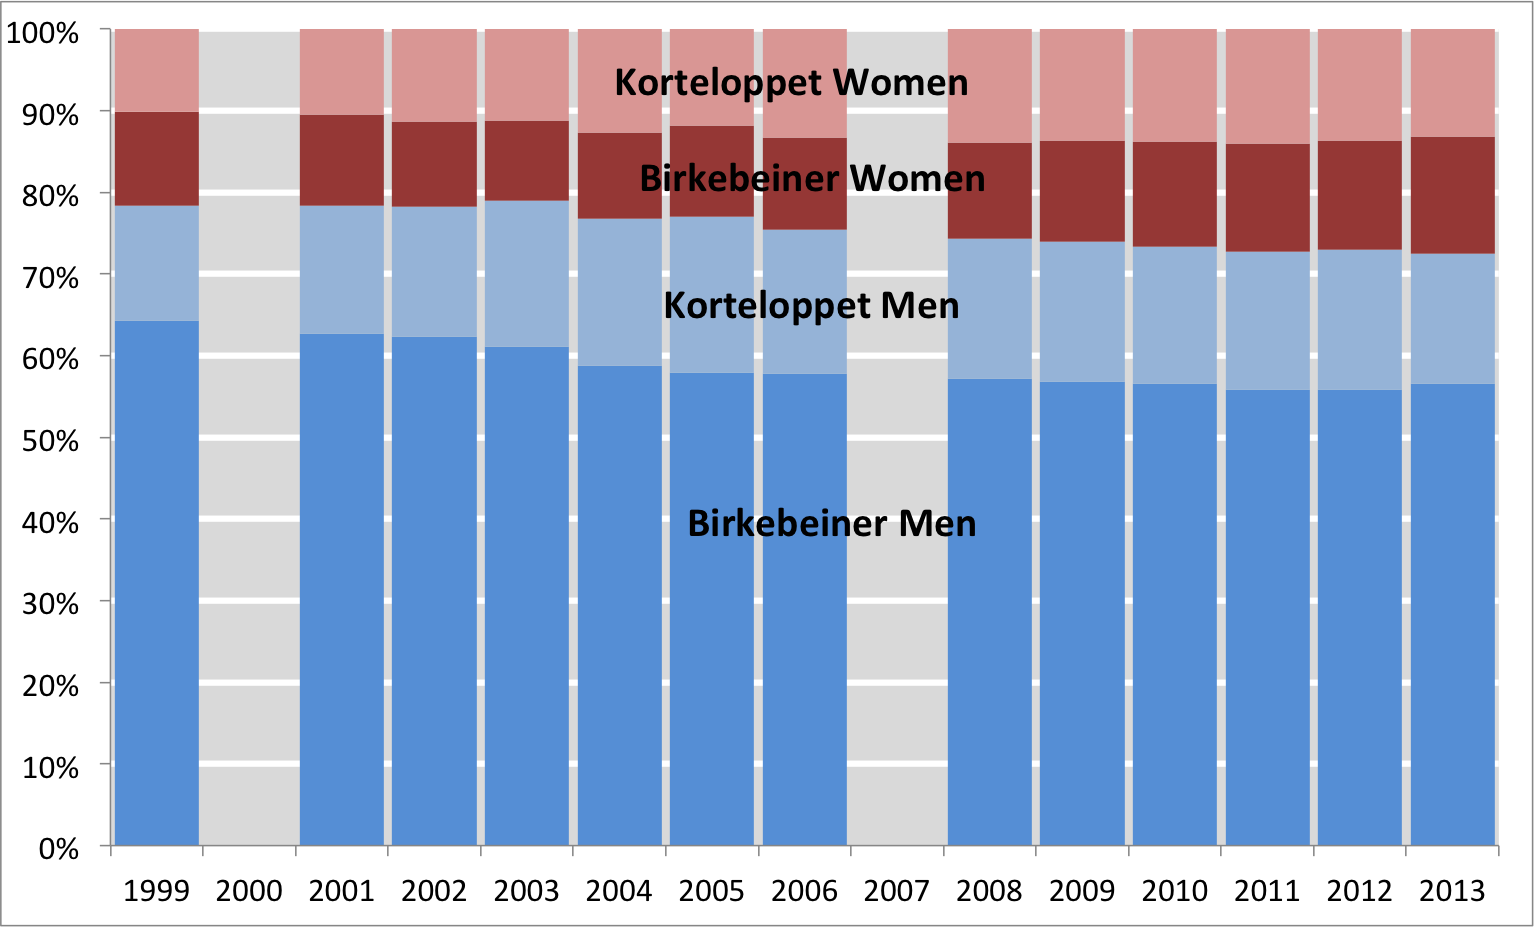
Over this time frame, more women have been skiing the race—female participation has gone from barely 20% in 1999 to nearly 30% this year. But take a look at the right side. In 2002, men in the Birkebeiner freestyle race accounted for more than half of the skiers in the race. By this year it was under 40%, even though during that time it has grown by several hundred participants.

As has long been the case, there are many more women in the Korteloppet than the Birkebeiner, but the rate of change is about the same for both races. The Birkie has gone from 15% women a decade ago to 20% today, while the korteloppet has gone from 40% to 45%. We still should get more women skiing the Birkie. Finally, there was an interesting quirk to these data. Most of the information in these charts is based off of data from results—from skiers who finished the race. The first chart, showing the Prince Haakon and other races (the Barnebirkie and such) is registration data. So, from 2008 onwards, we can chart out the percentage of registrants who completed the race. Any guess as to what happened starting in 2011?

Prior to 2011, about 90% of registrants finished the race. There was a big drop in 2011, which has continued (but stabilized somewhat) in 2012 and 2013. If just 2011 had had low numbers, I’d suspect the brutally cold temperatures that year. But since the trend continued to 2012 and 2013, there’s another explanation. I would venture a guess that it is the fact that the race started filling up. In 2010, if you were on the fence about skiing the Birkie, you’d wait until the last minute, sign up, pay a higher fee, and ski the race. But once the race started closing, if you were likely to want to ski the race, you’ll sign up early. If your plans changed, you’ll eat the fee and not show up. It seems that for somewhere on the order of 5 to 7% of race registrants, this is the case. That’s not an insignificant number; it means that somewhere on the order of 500 more skiers sign up for the Birkie but don’t race it than before the race closed early. Another interesting note: before the race closed, there was no real difference in finishing rates between Birkie and Korte skiers. Since it has, there has been relatively higher participation amongst Birkie skiers than Korte skiers.