Welcome to the third annual BirkieGuide.com statistics run. (Here’s 2011 and 2010 for you.) Many thanks as always to the Birkie for the data. We have most of the charts returning for last year (with a few exceptions—mainly where the updated chart would be a lot of work and show little new) and several new ones. And we’re going to try to have all of them accessible off of this page, which is prettier (thanks, WordPress) than the HTMLy stuff I had last year. (With a couple exceptions, which should open in separate windows.)
Here are links to a bunch of charts, grouped loosely by page. The search features with “extra data” are coming soon.
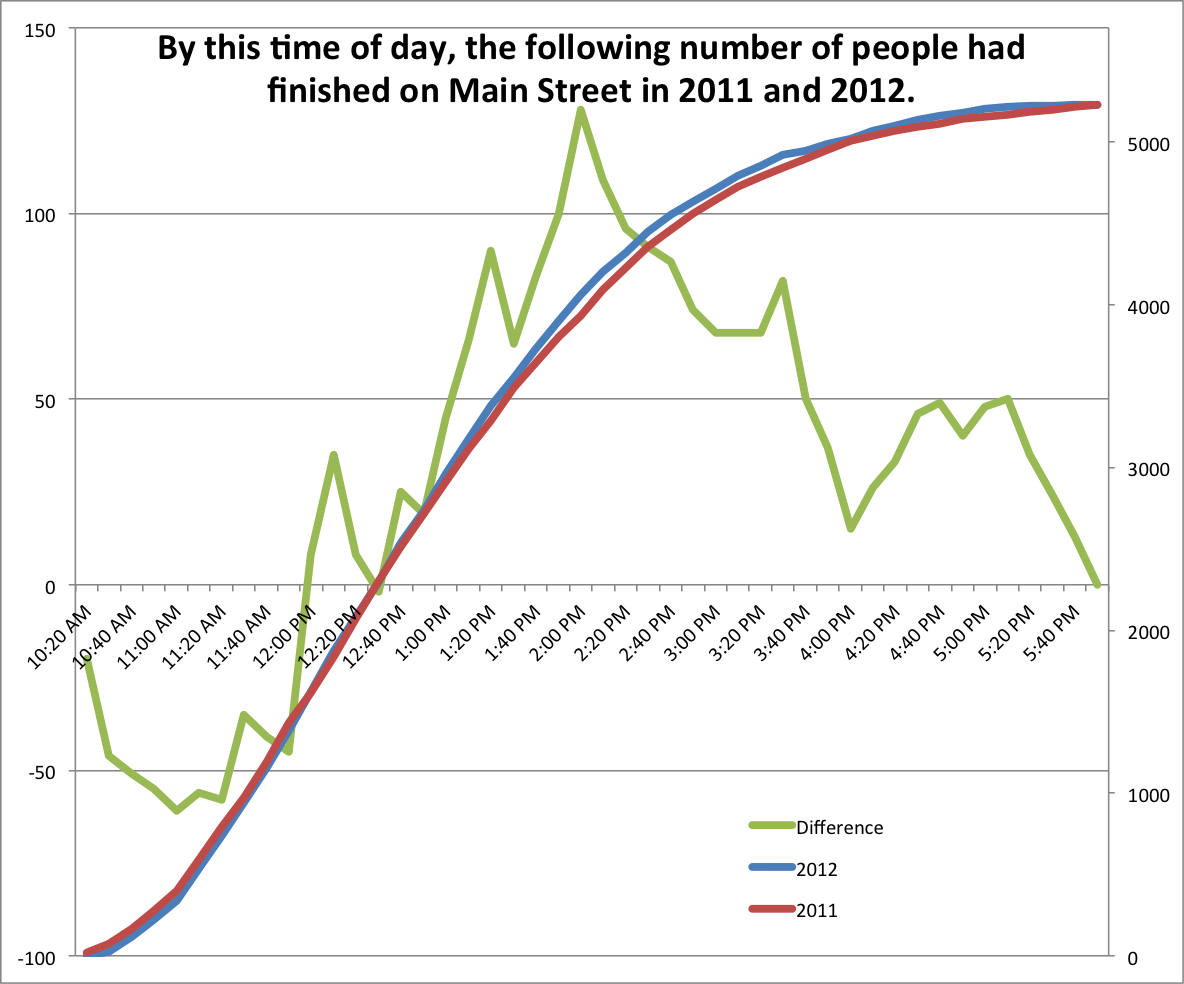
Want some new eye candy? Well, here’s a breakdown of the times of finishers on Main Street, 2011 vs 2012. The difference, for each five minute block, is whether there were more finishers at that time in 2011 (negative values) or 2012 (positive values). There were more early finishers last year and more later finishers this year, although the curves are pretty darn close. And, believe it or not, there were the same number of skiers down Main Street in both years!
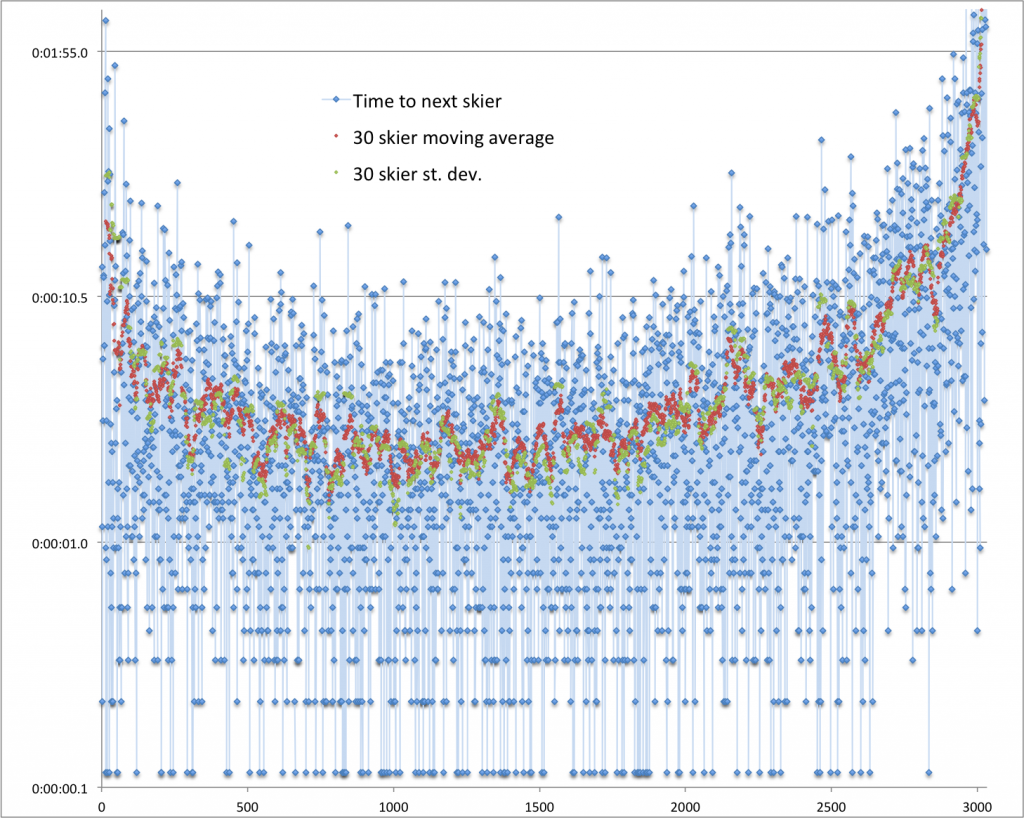
And here is the time between skiers on Main Street, on a logarithmic scale. In the thick of the race, the average time between finishers is only a couple of seconds. In fact, there are 43 ties in the Birkie men’s race alone (which can’t be shown on a log chart, so you’ll have to take my word for it). Although if a couple of skiers are sprinting at 20 mph down the street, they’ll cover about one meter in 0.1 seconds, so there’s a good reason we have cameras for photo finishes up front.
Fun, if appreciably nerdy, stuff. There’s a lot more where that came from:
Page descriptions:
- Age: How skiers stack up by age, wave and finishing time
- Gender: How males and females measure up
- Wave charts for Birkie FS, CL, Korte FS and CL: Charts showing finishers for each wave by technique.
- ’12 vs ’11: Some interesting tidbits looking at last year’s data
- Time points: Taking a look at the variability of speeds between the race splits
- Geography: Skier numbers and times by state—and selected cities.
- Correlations: Looking at how a skier’s place at different time points impacts his or her finishing time
- Weather: Looking at how snowfall and skiable days in the Twin Cities affect the Birkie.
- Results by wave and extra data: A searchable database for each skier with information such as place in wave by gender, distance traveled to the start and time to the timing wire, and finishing data for each wave. NB: this is hosted outside the confines of WordPress (i.e. this nice-looking site) and will look slightly different.

